

The following is an example of learning material in our Herbal Product Design masters program. Each time I engage students, I get to relearn material I’ve forgotten about. It’s like those movies we get to rewatch because we can’t remember what happens.
This is embedded in a phytochemistry course which emphasizes learning molecular shape from structure/function analysis related to clinical efficacy (enzymatic interactions, etc…), toxicity, solubility and choice of analytical methods. Once medicinal compounds have been separated, an important analytical question is how to detect them. UV detection connects the physics of light absorption with the chemistry of molecular structure. Research suggests that making meaningful connections across scientific disciplines can deepen conceptual understanding, particularly when students apply those connections to practical problems (Moon et al., 2018; Wright & Oliver-Hoyo, 2020; Zhou et al., 2025).
This posting builds from how molecules absorb light up to phytochemical spectra and the choice of detector. The detection method tables are reference material and sit in the appendices. Figure 1 provides a simplified illustration of how a UV detector measures light absorption: light passes through a sample, and the detector measures the light that remains. It illustrates the measurement principle, not the arrangement of the chromatography system.
Figure 1: Absorption in the Instrument - Beer–Lambert law in a UV spectrophotometer

1. Light and electrons
Light travels in small packets of energy called photons. The shorter the wavelength, the more energy each photon carries, so ultraviolet (UV) light at 200–400 nm carries more energy than visible light at 400–700 nm.
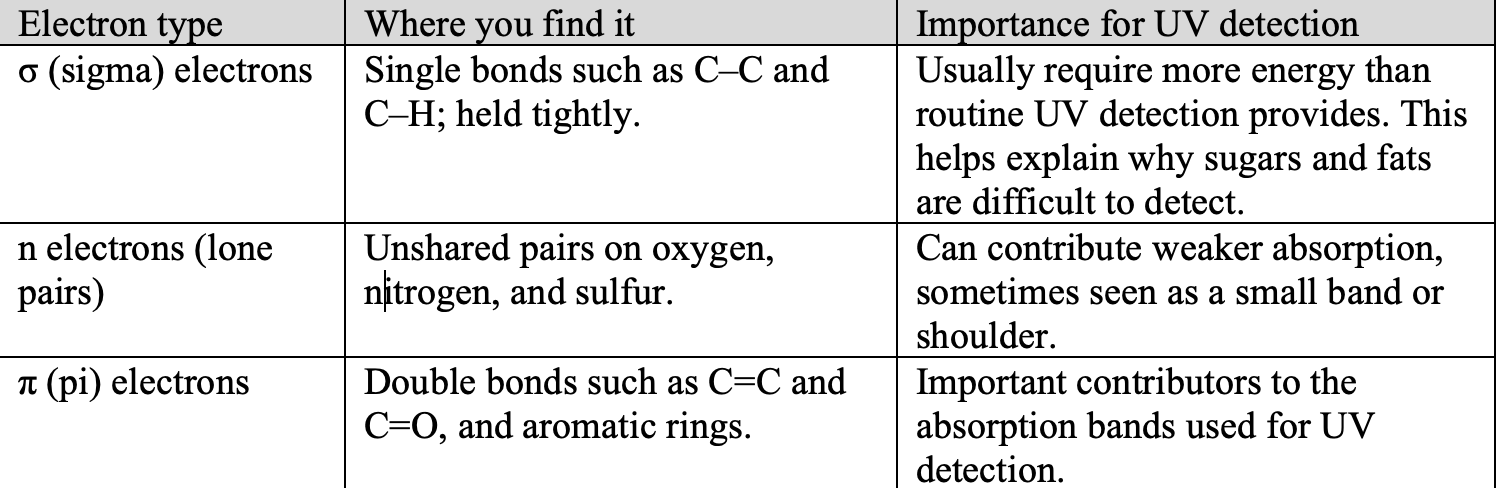
A molecule absorbs a photon only when the photon has the right amount of energy to lift one of the molecule’s electrons to a higher energy level. If no electron in the molecule can make that jump with the energy available, the light passes straight through, and a UV detector sees nothing. The part of a molecule that does the absorbing is called the chromophore. Electrons in different kinds of bonds respond differently to UV light. Table 1 summarizes the differences.
For UV detection of phytochemicals, the most important structural feature is conjugation, which is a connected arrangement of alternating single and double bonds often found in aromatic rings. Electrons are shared across this region, allowing the molecule to absorb UV light. Longer conjugated systems generally absorb at longer wavelengths. Nearby unshared electron pairs can also influence absorption.
Other groups attached to a conjugated structure can change how strongly a molecule absorbs UV light and the wavelengths it absorbs. For example, hydroxyl (–OH) and methoxy (–OCH₃) groups attached to an aromatic ring can influence the electrons within that ring. These groups are sometimes called auxochromes.
The location of a substituent matters more than its number alone: p-coumaric acid has one phenolic –OH group, whereas EGCG has eight distributed across three aromatic rings. Their effects depend on the conjugated system to which they are attached.
Table 1: Which Electrons Absorb UV and Visible Light
2. Anatomy of a chromophore
p-Coumaric acid, a common plant phenolic, contains each component found in typical plant chromophores (Figure 2).
Figure 2: Parts of a Chromophore in p-Coumaric Acid
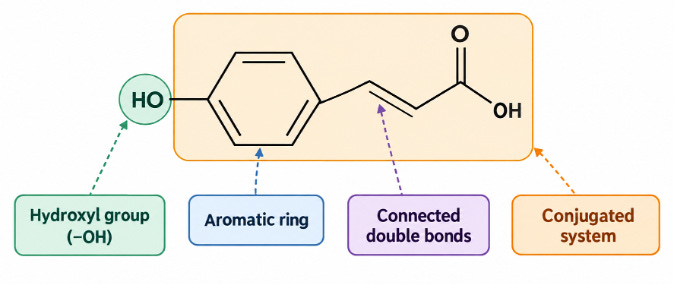
Note. The shaded region is the conjugated π system. The –OH on the left is an auxochrome.
The ring and the double bonds. In p-coumaric acid, the aromatic ring, connecting C=C bond, and carbonyl C=O bond form one continuous UV-absorbing region.
Conjugation is the continuous arrangement that allows p-coumaric acid to absorb as one system. Extensive conjugation, as in many carotenoids, can extend absorption into visible light.
Groups such as C=O and C=N contribute to UV absorption. Unshared electron pairs on oxygen or nitrogen can also influence the spectrum, sometimes producing weaker absorption.
The auxochrome. The hydroxyl (–OH) group on the aromatic ring of p-coumaric acid is an auxochrome (section 1). It shifts absorption toward longer wavelengths, a change called a bathochromic or red shift. Methoxy (–OCH₃), amino (–NH₂), and some oxygen-linked substituents can have similar effects.
At higher pH, removal of hydrogen from a phenolic –OH group can shift an absorption band to a longer wavelength, sometimes by tens of nanometers. Chemists may use different acids and pH levels to help determine the positions of free hydroxyl groups from changes in the spectrum.
Epigallocatechin gallate (EGCG): Molecular structure and UV detection
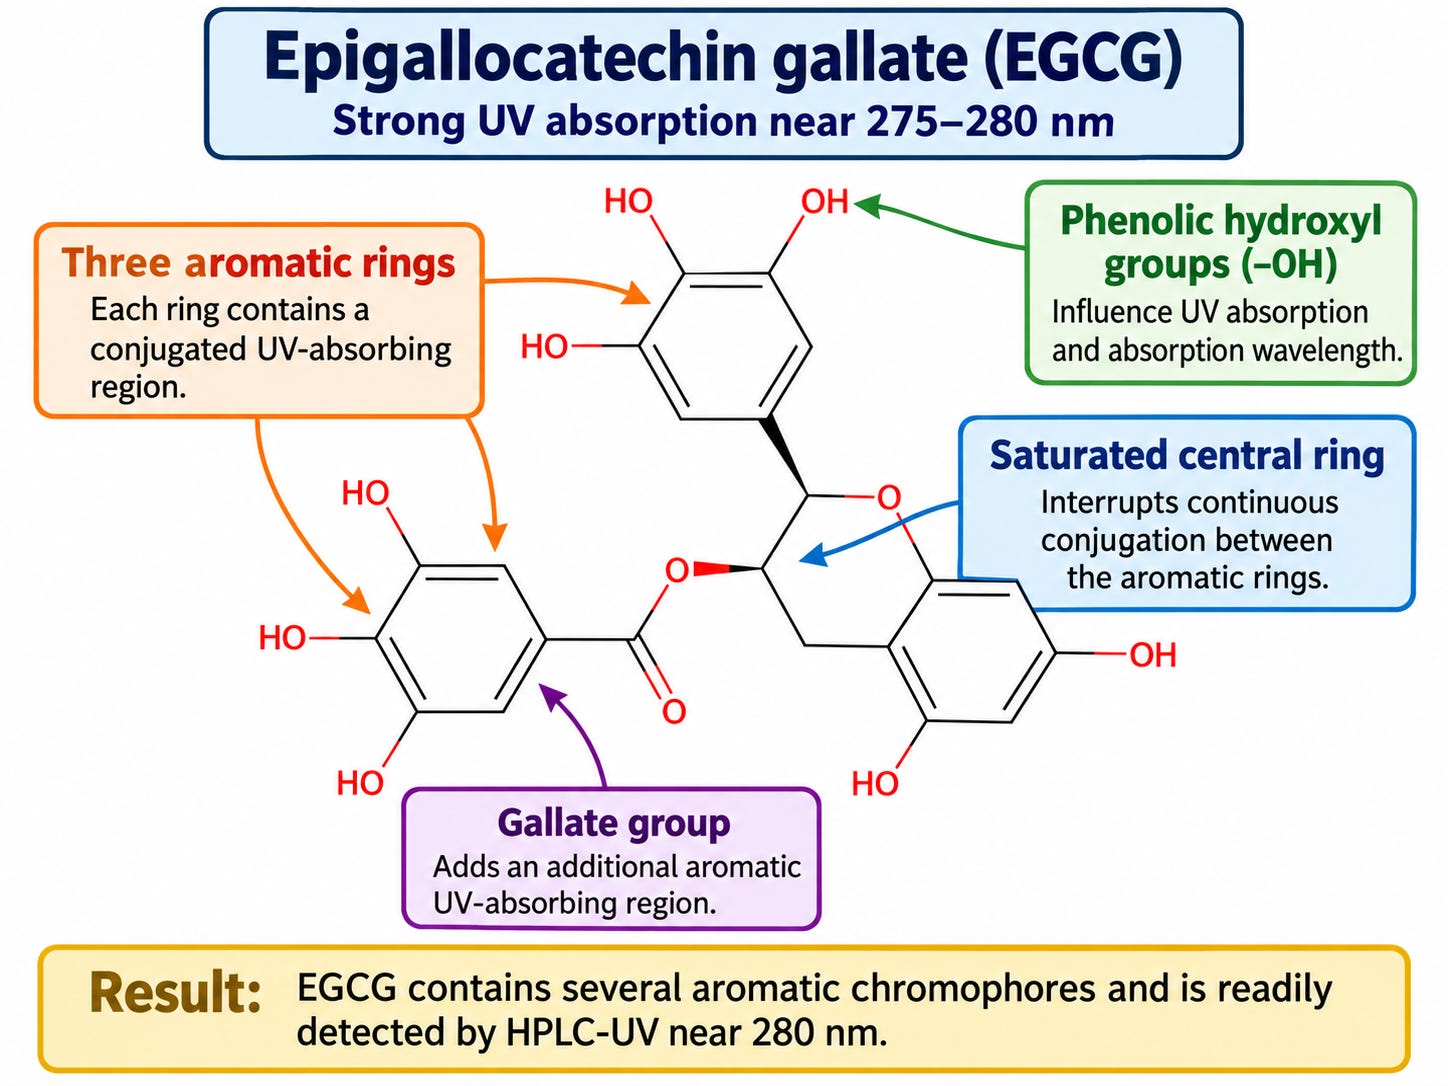
EGCG, a major catechin in green tea (Camellia sinensis), provides a contrast to p-coumaric acid. Its three aromatic rings form separate UV-absorbing regions rather than one continuous system. One of these rings belongs to the gallate group, which is attached through an ester linkage (Figure 3). Because the three aromatic rings are not connected through a continuous conjugated system, their electrons cannot delocalize across the entire molecule as they can across the connected aromatic ring and side chain of p-coumaric acid.
EGCG also has eight phenolic hydroxyl (–OH) groups distributed across its aromatic rings. Their positions influence absorption, but the number of hydroxyl groups alone does not predict wavelength. EGCG absorbs strongly near 275–280 nm, depending on solvent and measurement conditions (Snitsarev et al., 2013).
An HPLC UV detector set near 280 nm can detect EGCG effectively. However, many other plant phenolics also absorb at this wavelength. Consequently, detecting a peak at 280 nm does not, by itself, establish that the compound is EGCG. It shows only that something absorbs at the chosen wavelength. Identification requires additional evidence, such as a matching retention time and UV spectrum compared with an authenticated EGCG reference standard under the same chromatographic conditions.
Figure 3: Parts of a Chromophore in EGCG
In comparing the two molecules, p-coumaric acid can have a strong absorption band near 309–310 nm under acidic conditions (approximately pH 1–3), while at near-neutral pH (approximately pH 6–8), where the carboxyl group has lost its proton, the maximum moves to about 283–285 nm (Miyagusuku-Cruzado et al., 2020; Putschögl et al., 2008). EGCG absorbs most strongly near 275–280 nm under commonly reported measurement conditions. The wavelength at which a compound absorbs most strongly is called its λmax (lambda maximum). A UV detector generally produces a stronger signal when operated near a compound’s absorption maximum. Published absorption maxima are starting points for choosing a detection wavelength.
3. What absorption looks like
A UV detector measures how much light a compound absorbs. Under appropriate conditions, Beer–Lambert’s law describes how absorbance increases with concentration. Less light leaving the sample means greater absorbance.
What a UV spectrum tells us:
Absorption bands. A molecule absorbs a range of nearby wavelengths, producing a band on a UV spectrum.
Absorption maximum (λmax). The highest point of an absorption band shows the wavelength at which the compound absorbs most strongly. This helps select a detection wavelength.
Concentration and signal. For the same compound under the same conditions, higher concentration generally produces greater absorbance. Different compounds can absorb the same wavelength with different strengths.
Reading chromatographic peaks. Peak size depends both on the amount of compound and on how strongly it absorbs at the selected wavelength. A larger UV peak does not necessarily mean one phytochemical is more abundant than another; quantitative comparisons require suitable compound-specific calibration.
4. Chromophores across phytochemical classes
With these structural principles in mind, Figure 4 provides a schematic guide to UV and visible absorption regions associated with different phytochemical classes. The bars are illustrative, not experimentally established ranges for every compound in a class.
Figure 4. Illustrative UV–Visible Absorption Regions by Phytochemical Class
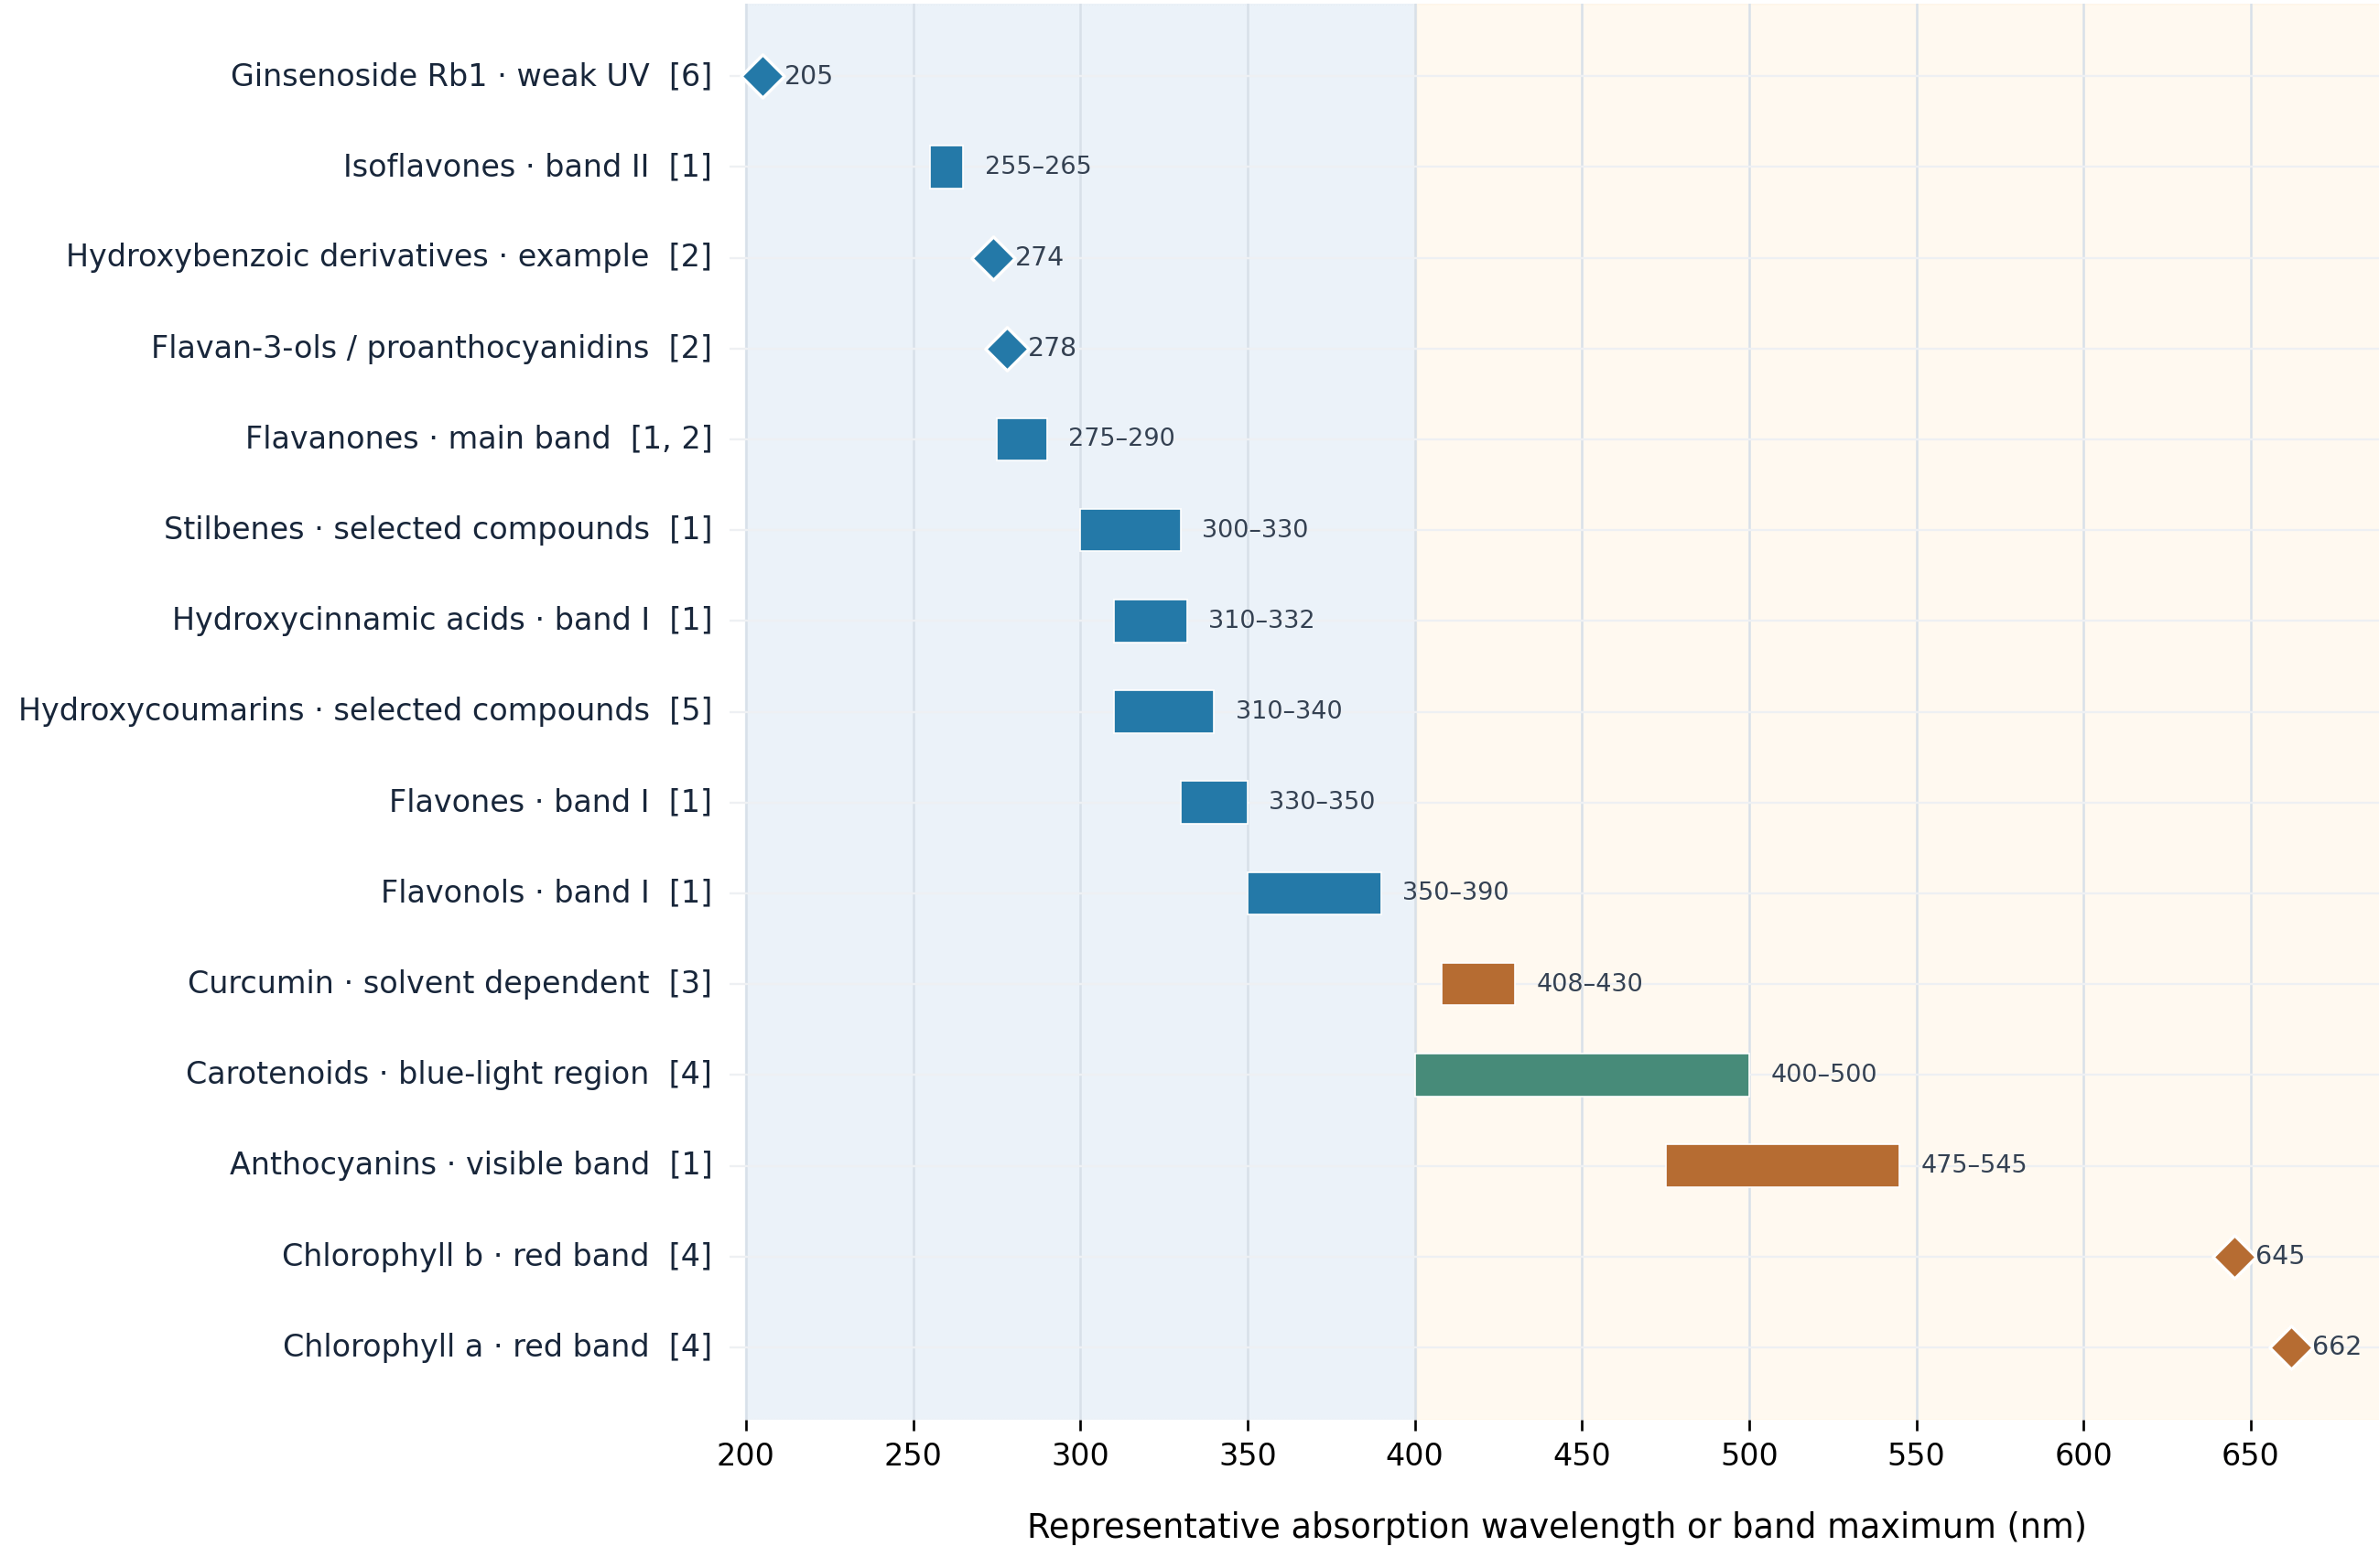
Note. The spectral regions are illustrative ranges assembled from published measurements and reviews of selected phytochemicals (Cerovic et al., 2002; Lin & Harnly, 2012; Lichtenthaler, 1987; Priyadarsini, 2009). Absorption maxima vary with molecular structure, substitution, solvent, pH, and measurement conditions. The ranges indicate characteristic spectral regions of representative compounds rather than universal absorption limits for entire phytochemical classes.
Reading the spectra
Figure 4 illustrates where compounds from different phytochemical classes may absorb light. The ranges are conceptual examples rather than values derived from a single identified experimental dataset. Individual compounds can absorb at different wavelengths within or outside the illustrated regions, depending on their structures and measurement conditions.
5. From spectra to detector
Knowing where a phytochemical absorbs UV light helps determine how it should be detected after chromatographic separation. Two common detection systems are single-wavelength UV detectors and photodiode-array detectors (PDA), also called diode-array detectors (DAD).
Photodiode-array detection (PDA/DAD)
A single-wavelength UV detector measures absorption at one selected wavelength during the chromatographic run. A PDA detector measures absorption across many wavelengths during the same chromatographic run. Suppose a plant extract contains both EGCG and p-coumaric acid. A PDA detector can record the absorption spectrum of each separated compound, allowing EGCG to be examined near 280 nm and p-coumaric acid near 310 nm under suitable acidic conditions and with an appropriate solvent.
A PDA detector also provides additional information about each chromatographic peak. The shape of its UV spectrum can help determine whether a peak is consistent with the expected compound. However, similar spectra, large concentration differences, and complete coelution can prevent PDA analysis from revealing overlapping compounds. Spectral agreement is therefore evidence of consistency, not proof of peak purity or identity (Preda et al., 2024).
Which detector should be selected?
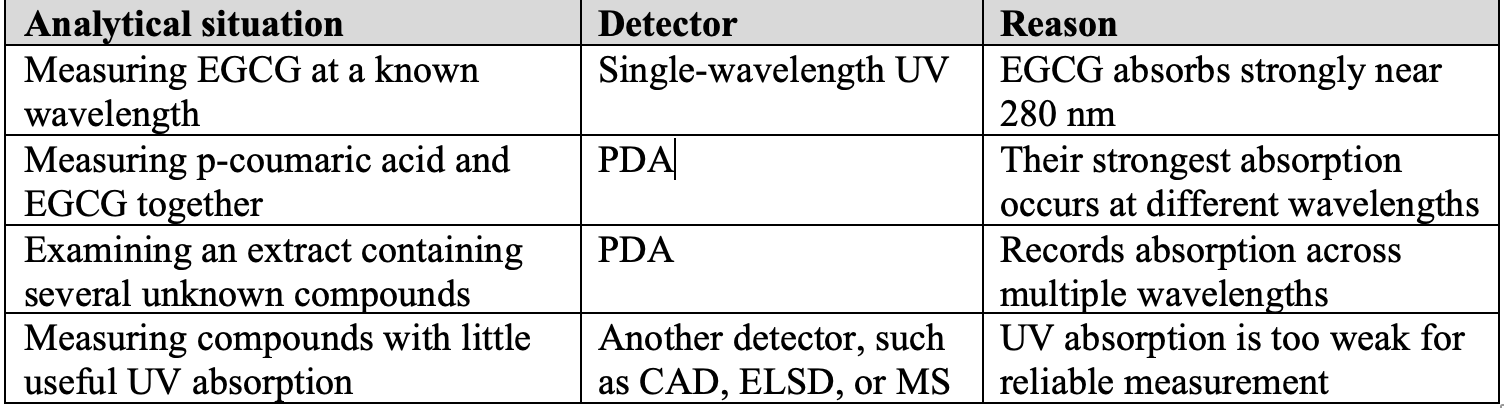
For routine measurement of a known compound at an established wavelength, a single-wavelength UV detector may be sufficient. For examining several compounds with different absorption profiles, developing analytical methods, or comparing chemical fingerprints, a PDA detector provides more information. Both systems depend on compounds absorbing light. Neither is ideal for phytochemicals that lack useful UV-absorbing structures.
Table 3: Choosing between UV, PDA, and non-UV detection
When UV detection is not sufficient
Some phytochemicals have little or no useful UV absorption because their structures lack extended conjugated systems. For these compounds, even a PDA detector may provide a weak signal. Detection at very short UV wavelengths is sometimes possible, but solvents can also absorb light in this region, making measurements more difficult. Other detectors can measure compounds through different physical or chemical properties.
· ELSD (evaporative light-scattering detection): Measures light scattered by particles remaining after the solvent evaporates.
· CAD (charged aerosol detection): Measures electrically charged particles formed from compounds after the solvent evaporates.
· MS (mass spectrometry): Detects ions according to their mass-to-charge ratios.
These methods allow compounds with weak UV absorption to be measured without depending on a strong chromophore. The choice depends on the compounds being investigated and the information the analysis must provide. ELSD, CAD, and MS are not interchangeable. The appropriate choice also depends on the sensitivity, selectivity, quantitative requirements, and compatibility of the detector with the chromatographic method.
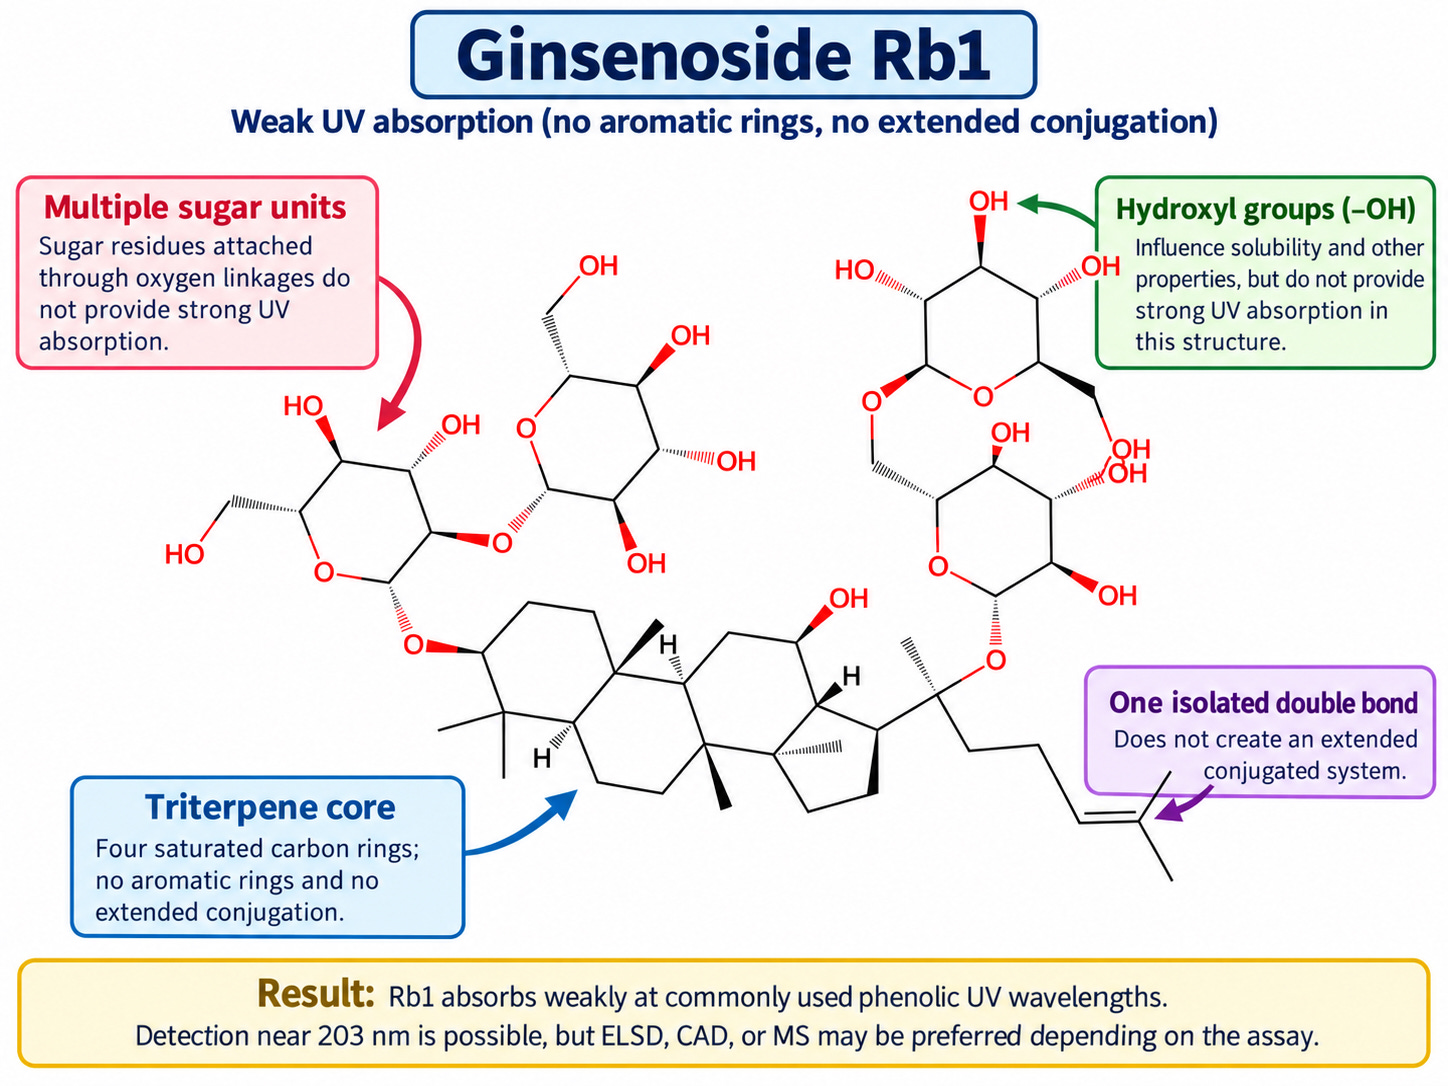
Connecting structure to analytical method choice example: Ginsenoside Rb1
Ginsenoside Rb1 is a major saponin found in ginseng (Panax species). Figure 5 identifies its four sugar units, nonaromatic triterpene core, one isolated C=C bond, and hydroxyl groups. Unlike p-coumaric acid and EGCG, Rb1 has no extended conjugated system, so it absorbs weakly at UV wavelengths commonly used for plant phenolics.
Historically, HPLC with short-wavelength UV detection (approximately 200–205 nm) has been widely used to measure ginsenosides because the equipment is readily available and relatively inexpensive, although weak UV absorption can limit sensitivity and increase interference from solvents and other compounds (Fuzzati, 2004; Hsu et al., 2022). If cost is not a factor, LC-MS/MS is generally the preferred method for comprehensive, selective identification and quantification of individual ginsenosides, particularly in complex plant extracts, because it provides greater molecular specificity and sensitivity without requiring strong UV absorption (Hayes et al., 2022; Moldoveanu & Gan, 2023).
Figure 5: Ginsenoside Rb1
References
Cerovic, Z. G., Ounis, A., Cartelat, A., Latouche, G., Goulas, Y., Meyer, S., & Moya, I. (2002). The use of chlorophyll fluorescence excitation spectra for the non-destructive in situ assessment of UV-absorbing compounds in leaves. Plant, Cell & Environment, 25(12), 1663–1676. https://doi.org/10.1046/j.1365-3040.2002.00942.x
Fuzzati, N. (2004). Analysis methods of ginsenosides. Journal of Chromatography B, 812(1–2), 119–133. https://doi.org/10.1016/j.jchromb.2004.07.039
Grinberg, N., & Medvedovici, A.-V. (2024). Peak spectral homogeneity in LC/DAD: Exploring alternatives in peak purity evaluations. Processes, 12(12), 2887. https://doi.org/10.3390/pr12122887
Hayes, H. V., Wilson, W. B., & Rimmer, C. A. (2022). Method development for the determination of seven ginsenosides in three Panax ginseng reference materials via liquid chromatography with tandem mass spectrometry. Analytical and Bioanalytical Chemistry, 414(29–30), 8215–8222. https://doi.org/10.1007/s00216-022-04378-9
Hsu, B.-Y., Jen, C.-T., Inbaraj, B. S., & Chen, B.-H. (2022). A comparative study on analysis of ginsenosides in American ginseng root residue by HPLC-DAD-ESI-MS and UPLC-HRMS-MS/MS. Molecules, 27(10), 3071. https://doi.org/10.3390/molecules27103071
Lin, L.-Z., & Harnly, J. M. (2012). Quantitation of flavanols, proanthocyanidins, isoflavones, flavanones, dihydrochalcones, stilbenes, benzoic acid derivatives using ultraviolet absorbance after identification by liquid chromatography–mass spectrometry. Journal of Agricultural and Food Chemistry, 60(23), 5832–5840. https://doi.org/10.1021/jf3006905
Lichtenthaler, H. K. (1987). Chlorophylls and carotenoids: Pigments of photosynthetic biomembranes. Methods in Enzymology, 148, 350–382. https://doi.org/10.1016/0076-6879(87)48036-1
Miyagusuku-Cruzado, G., García-Cano, I., Rocha-Mendoza, D., Jiménez-Flores, R., & Giusti, M. M. (2020). Monitoring hydroxycinnamic acid decarboxylation by lactic acid bacteria using high-throughput UV-Vis spectroscopy. Molecules, 25(14), 3142. https://doi.org/10.3390/molecules25143142
Moldoveanu, S. C., & Gan, H. (2023). Comparison of two methods for ginsenosides quantitation. Journal of Separation Science, 46(6), Article e2201063. https://doi.org/10.1002/jssc.202201063
Moon, A., Zotos, E., Finkenstaedt-Quinn, S., Gere, A. R., & Shultz, G. (2018). Investigation of the role of writing-to-learn in promoting student understanding of light–matter interactions. Chemistry Education Research and Practice, 19(3), 807–818. https://doi.org/10.1039/C8RP00090E
Preda, D.-M., Comănescu, M.-A., Voicu, V., Grinberg, N., & Medvedovici, A.-V. (2024). Peak spectral homogeneity in LC/DAD: Exploring alternatives in peak purity evaluations. Processes, 12(12), Article 2887. https://doi.org/10.3390/pr12122887
Priyadarsini, K. I. (2009). Photophysics, photochemistry and photobiology of curcumin: Studies from organic solutions, bio-mimetics and living cells. Journal of Photochemistry and Photobiology C: Photochemistry Reviews, 10(2), 81–95. https://doi.org/10.1016/j.jphotochemrev.2009.05.001
Putschögl, M., Zirak, P., & Penzkofer, A. (2008). Absorption and emission behaviour of trans-p-coumaric acid in aqueous solutions and some organic solvents. Chemical Physics, 343(1), 107–120. https://doi.org/10.1016/j.chemphys.2007.10.031
Snitsarev, V., Young, M. N., Miller, R. M. S., & Rotella, D. P. (2013). The spectral properties of (−)-epigallocatechin 3-O-gallate (EGCG) fluorescence in different solvents: Dependence on solvent polarity. PLOS ONE, 8(11), e79834. https://doi.org/10.1371/journal.pone.0079834
Wright, L. C., & Oliver-Hoyo, M. T. (2020). Student assumptions and mental models encountered in IR spectroscopy instruction. Chemistry Education Research and Practice, 21(2), 426–437. https://doi.org/10.1039/C9RP00113A
Zhou, S., Dong, Z., Wang, H. H., & Chiu, M. M. (2025). A meta-analysis of STEM integration on student academic achievement. Research in Science Education, 55, 1273–1302. https://doi.org/10.1007/s11165-024-10216-y